

Discover How Inverted hammer works & What does it indicated ?
- Prathamesh Tawde
- October 28, 2023
Have you ever wondered about those colorful candlestick charts? You see them in financial analysis. In technical analysis, these charts are very useful. They help us understand market trends.
Among the various candlestick patterns, the inverted hammer is one you might want to keep an eye on. This pattern is distinctive. It can show when prices might reverse. This makes it a valuable tool for traders.
Characteristics of inverted hammer candlestick

Let’s break down the key characteristics of the pattern:
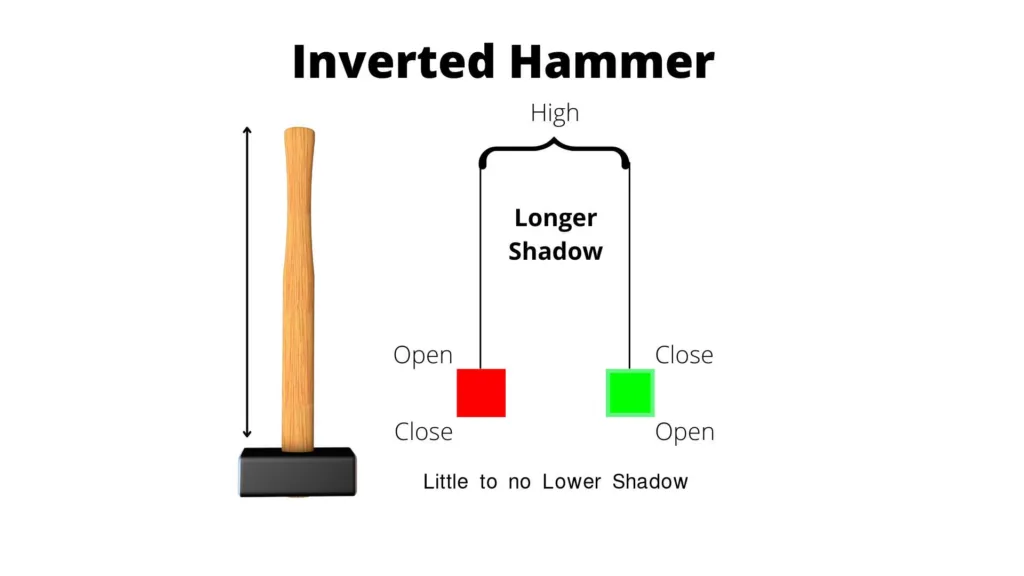
Small Body: The candle’s body is small. This shows that its opening and closing prices are close.
Long Upper Shadow:The upper shadow is long. It shows that the price rose a lot, but then fell.
Little to No Lower Shadow: The absence or tiny lower shadow means that the opening price was near the lowest price.
Positioning: It occurs at the bottom of a downtrend, suggesting a potential reversal.
Is an Inverted Hammer Bullish or Bearish?
When you find a pattern see it as a sign that the downtrend is losing steam and may reverse. But, it’s crucial to wait for confirmation before making any trading decisions.
Confirmation often comes in the form of the next candlestick. If the candlestick is bullish,and if it closed above the previous one’s high. This suggests the start of a Bullish Trend.
How to Trade the Inverted Hammer Candlestick Pattern
To trade the Candlestick pattern, you wait for confirmation. You then use it as a potential entry point for a long position. Here are some strategies to consider:
Confirmation Candle: Wait for a bullish candlestick to follow the pattern. This could be a sign that the reversal is underway.
Stop Loss: Set a stop loss below the low of the inverted hammer candle to manage risk.
Set profit targets based on the risk-to-reward ratio you like.
Mix it with other indicators. They include moving averages, RSI, and MACD.
Green vs Red inverted hammer candle
Green Candlestick
It is a green inverted hammer candle. It has a small green (bullish) body. This shows that the closing price was higher than the opening price.
The presence of a green body implies that the bulls (buyers) gained control by the end of the trading period. They pushed the price up from the open. This could be a stronger signal of a potential bullish reversal. It means that buyers were strong enough to close the price higher.
Traders may look for a green candle to follow the green inverted hammer. This confirms a trend reversal.
Red Candlestick
A red inverted hammer candle has a small red (bearish) body. It shows that the closing price was lower than the opening price.
The red body’s presence means the bears (sellers) still had some control at the end of trading. They closed the price lower than the open. Yet, the long upper shadow shows that the bulls attempted to push the price higher.
Traders may still look for a bullish candlestick. It should follow the red inverted hammer. This is to confirm a reversal. But, the reversal signal may be slightly weaker than with a green inverted hammer
Both green and red candles can signal potential bullish reversals. They appear at the bottom of a downtrend.
But, a green may offer a stronger sign of a reversal. This is because its close is bullish.
No matter the color, traders should wait for confirmation.
Is a Shooting Star the Same as An Inverted Hammer?
The inverted hammer and shooting star patterns look alike. But, their context and implications differ.
Inverted Hammer: Appears at the bottom of a downtrend. It suggests a potential bullish reversal.
Shooting Star: Appears at the top of an uptrend and suggests a potential bearish reversal.
Limitations of candlestick pattern
While the pattern can be a valuable tool in a trader’s arsenal, it has limitations.
Like any technical indicator, it is not foolproof. It may generate false signals sometimes.
So, it is crucial to use this pattern with other indicators. You must also do thorough analysis before making trading decisions.
Inverted hammer chart pattern example
Conclusion
In conclusion, the pattern is a valuable pattern for traders. It helps them find potential bullish reversals in the market.
This pattern signals a potential shift from a downtrend to an uptrend. It lets traders enter long positions at a good time. Yet, it is crucial to confirm the pattern with other indicators or patterns. This increases the reliability of your trading decisions.
Like any trading strategy, using the candlestick requires practice. It also requires careful risk management.
An inverted hammer is a bullish pattern. It appears after a downtrend, signaling a reversal. It has a small real body at the lower end of the trading range and a long upper shadow with little to no lower shadow.
An Inverted Hammer forms when the price opens lower. Then, it rallies much higher during the session, but closes near its opening price. This creates a small body with a long upper shadow.
The Inverted Hammer suggests that selling pressure was present in the downtrend. It may be weakening. It indicates a potential reversal. Buyers are starting to step in and drive prices higher during the session.
Look for a candlestick with a small body and a long upper shadow following a series of declining prices. The candle should resemble an upside-down hammer.
The Inverted Hammer is more reliable when confirmed by the next candlestick. A strong bullish candle follows the Inverted Hammer. It makes a reversal more likely.


I’m Prathamesh Tawde, a leading figure in the dynamic world of financial markets. Born on March 30, 1986, in the vibrant city of Thane, Maharashtra, I’ve nurtured a profound passion for technical analysis and a commitment to guiding individuals toward successful trading journeys. With a mission to empower and educate, I’ve carved a distinct niche as a content creator, educator, and mentor.
