

Doji Candlestick :- Complete Guide for Successful Trading 2024
- Prathamesh Tawde
- February 13, 2024
Doji Candlestick Pattern
When the open and close price of a candle are almost the same or exactly the same, it forms a Doji Candlestick. A perfect Doji would have the same open and close, which is a sign of indecision among traders.
Types of Doji Candlestick Pattern
Doji candlesticks come in various forms, each conveying unique market sentiments. Let’s take a look into various types of Doji’s
Here’s a list of different types of Doji candles:
- Standard Doji
- Long Legged Doji
- Dragonfly Doji
- Hammer Doji
- Gravestone Doji
- Rickshaw Man Doji
- Four Price Doji
- Tri Star Doji
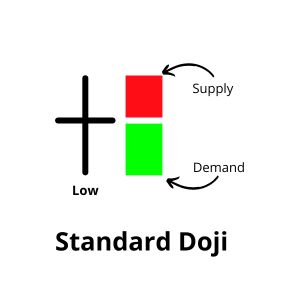
Standard Doji
Standard Doji pattern has the Same Open and Close along with a small trading range, the high and low are not too far from away.
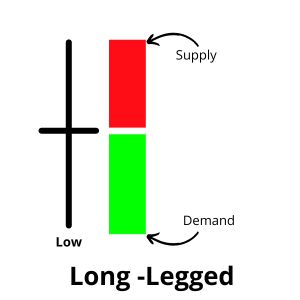
Long Legged Doji Candlestick
A long-legged doji has a huge trading range where the high and low are very far away from each other indicating a long upper shadow and lower shadows.
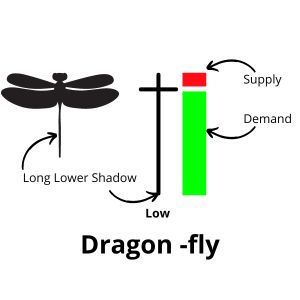
Dragonfly Doji Candlestick
This doji looks like a dragonfly’s body. The opening and closing of the doji are close to the top of the candle.
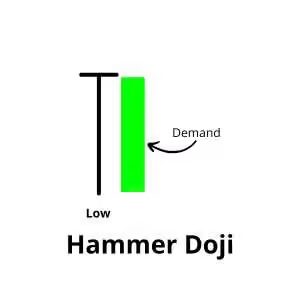
Hammer Doji
This doji looks like a Hammer. The opening and closing of the doji are at the top of the candle.
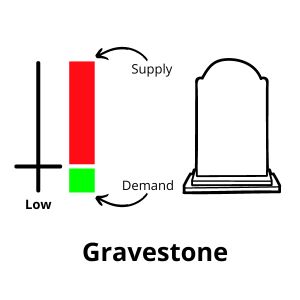
Gravestone Doji Candlestick
For a Gravestone Doji, the open and close is near to the low of the candle
Rickshaw Man Doji
A Rickshaw Man is a Doji Pattern which looks like Spinning Top candle Pattern but has a relatively small body.
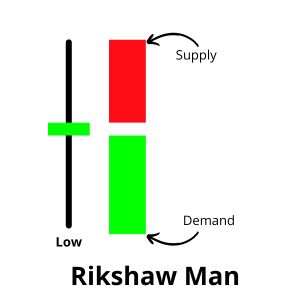
Rickshaw Man Doji Vs Spinning Top Pattern
A Rickshaw Man Doji Has a very small body compaired to that of the Spinning top Pattern
A spinning top Pattern has a visiable body as compaired to that of a Rikshaw Man Doji
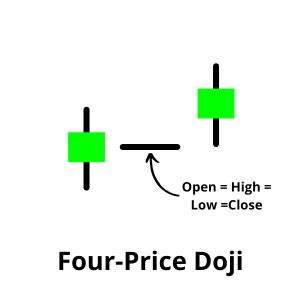
Four-Price Doji
This is a very rare type of doji, in this doji, the Open, High, Low and Close are all the same. This pattern can be seen in stocks where there is very low trading liquidity and very low trading volume.
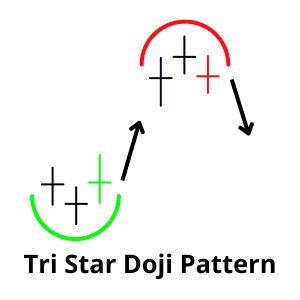
The Tri-Star
This is not a doji. It’s a very rare pattern made up of three doji candles. It indicates a strong possible reversal in the trend.
Psychology Behind the Doji Candlestick Pattern
Imagine a Tug-of-War between the buyers and the sellers with no clear winner. The pattern indicates confusion in the market trend with no clear indications
While A Standard Doji and Long-Legged Doji may not state a clear trend.
Dragonfly, Gravestone, Northern and Southern Doji may give you a sense of direction.
Doji Candlestick at the Top.
Traders value Doji for their ability to call market tops. A doji’s negative implications in uptrends arise from its representation of indecision. Indecision or uncertainty by buyers will not maintain an uptrend. Buyers must have the conviction to keep a rally going. A Doji at the top of a rally signifies a huge probability of a trend change.
The Following Doji candles are more Effective at the Top
Gravestone Doji
Tri -Star Doji Pattern
Standard Doji, Long-Legged Doji, and Four-Price Doji may also signal a reversal. Yet, the above two Doji state a stronger sign.
Doji Candlestick at the Bottom.
A Doji observed at the bottom of a decline suggests a significant likelihood of a trend reversal, indicating that market participants are hesitant, and there is potential for a shift in momentum.
The Following Doji candles are more Effective at the bottom
Dragon Fly Doji
Tri – Star Doji Pattern
Standard Doji, Long-Legged Doji, and Four-Price Doji may also signal a reversal. Yet, the above two Doji state a stronger sign of reversal.
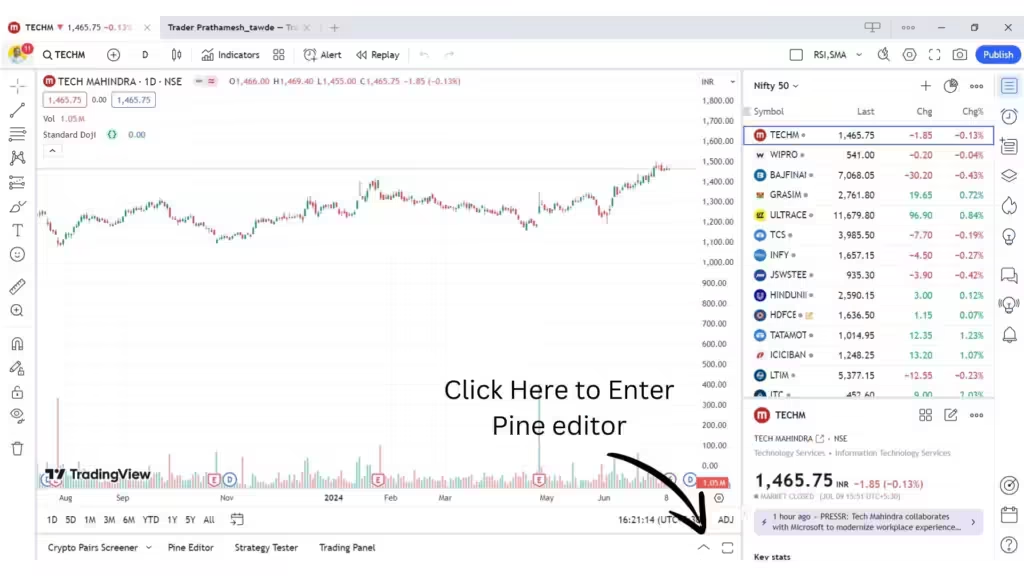
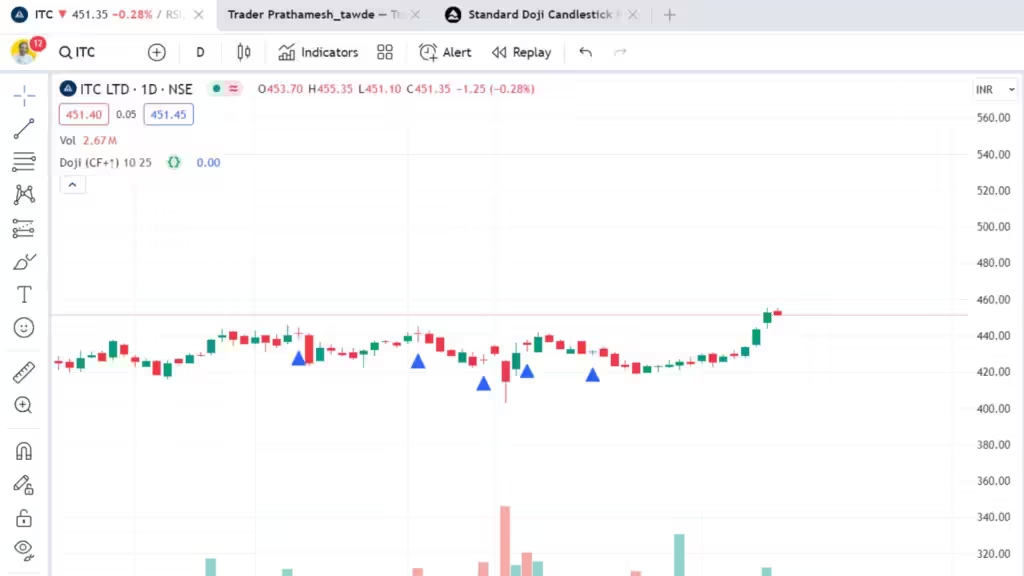
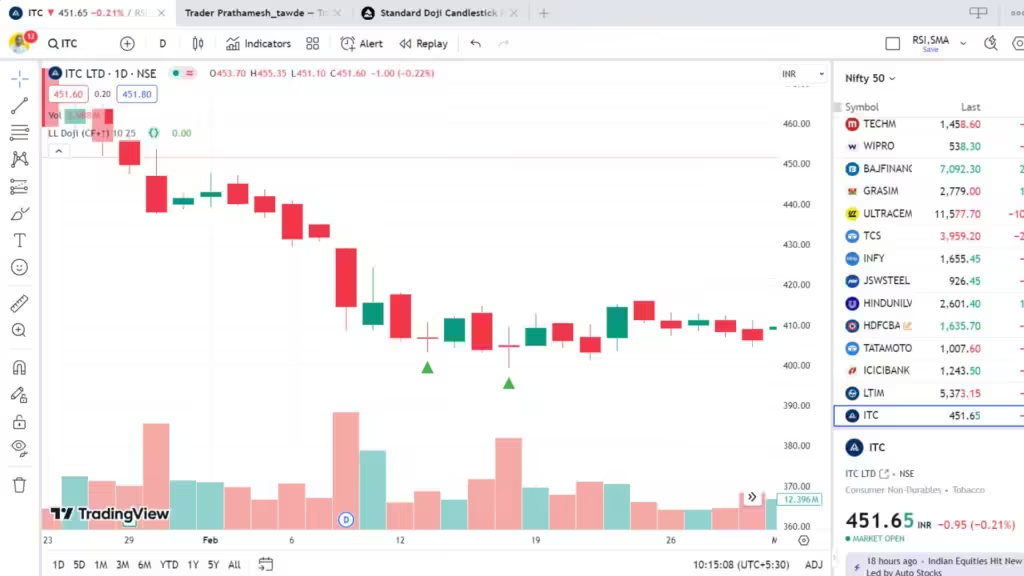
Identifying Doji Candlestick Patterns using TradingView Pine Script
To help traders recognize this pattern on TradingView charts, the following Pine Script code highlights Doji candles with a small triangle shape above them. Incorporate this script into your TradingView workspace to enhance your analysis of market sentiment and potential trend reversals.
To Download Trading View for Windows or macOS Click Here
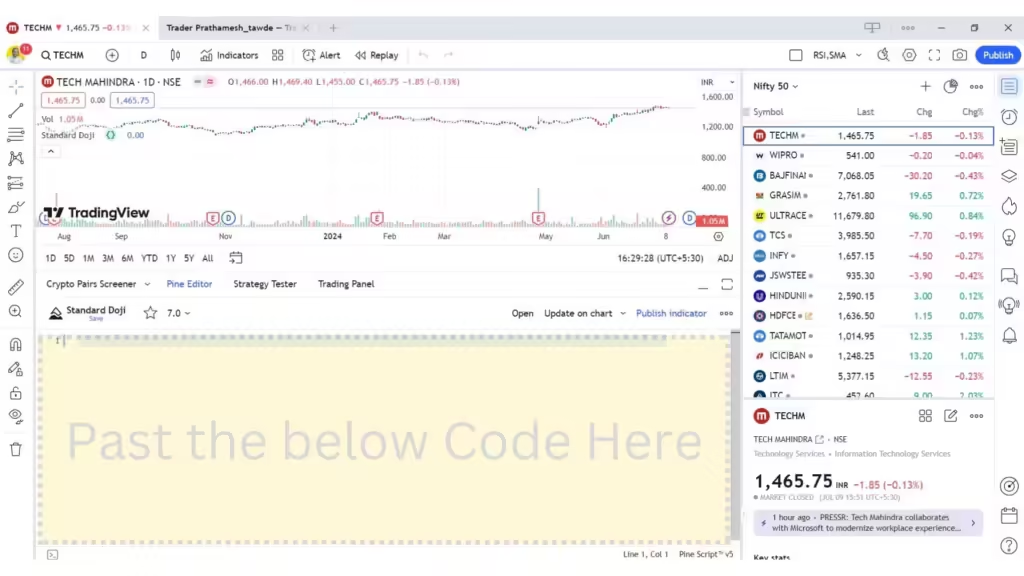
Here is Step By Step Process to use Pine Script In Trading View
- Copy the Code given Below
- Past the Code in Pine Editor
Standard Doji
Long Legged Doji
//@version=5
indicator(title=”Long-Legged Doji (Center-Filtered with Upward Triangle)”, shorttitle=”LL Doji (CF+↑)”, overlay=true)
// Doji Tolerance (Percentage of candle range)
bodyTolerance = input.float(10.0, “Body Tolerance (%)”, minval=0, maxval=100)
centerTolerance = input.float(25.0, “Center Tolerance (%)”, minval=0, maxval=100)
// Calculate Body Ratio, Center of Candle, and Allowed Deviation
bodyRatio = math.abs(close – open) / (high – low) * 100
center = (high + low) / 2
allowedDeviation = (high – low) * centerTolerance / 100
// Condition for Long-Legged Doji near Center
isLongLeggedDoji = bodyRatio <= bodyTolerance // Small body compared to range
isNearCenter = math.abs(open – center) <= allowedDeviation and math.abs(close – center) <= allowedDeviation
// Combine Conditions for Plotting
plotDoji = isLongLeggedDoji and isNearCenter
// Plot the Doji
plotshape(plotDoji, style=shape.triangleup, location=location.belowbar, color=color.green, size=size.small, offset=0)
Dragonfly Doji
//@version=5
indicator(title=”Dragonfly Doji Candlestick Pattern”, shorttitle=”Dragonfly Doji”, overlay=true)
// Condition for Dragonfly Doji
isDragonflyDoji = (high – low) / (open – low) >= 3 and (high – low) / (high – close) <= 0.1
// Plotting Dragonfly Doji
plotshape(isDragonflyDoji, style=shape.triangleup, location=location.belowbar, color=color.red, size=size.small)
Hammer Doji
//@version=5
indicator(title=”Dragonfly Doji Candlestick Pattern”, shorttitle=”Dragonfly Doji”, overlay=true)
// Condition for Dragonfly Doji
isDragonflyDoji = (high – low) / (open – low) >= 3 and (high – low) / (high – close) <= 0.1
// Plotting Dragonfly Doji
plotshape(isDragonflyDoji, style=shape.triangleup, location=location.belowbar, color=color.red, size=size.small)
Gravestone Doji
//@version=5
indicator(title=”Gravestone Doji Candlestick Pattern”, shorttitle=”Gravestone Doji”, overlay=true)
// Condition for Gravestone Doji
isGravestoneDoji = open > close and (high – open) / (0.001 + high – low) > 0.6 and (high – close) / (0.001 + high – low) > 0.6
// Plotting Gravestone Doji
plotshape(isGravestoneDoji, style=shape.triangleup, location=location.belowbar, color=color.orange, size=size.small)
Rikshaw man Doji
//@version=5
indicator(title=”Rickshaw Man Doji Candlestick Pattern”, shorttitle=”Rickshaw Man Doji”, overlay=true)
// Condition for Rickshaw Man Doji
isRickshawManDoji = abs(close – open) / (high – low) <= 0.1
// Plotting Rickshaw Man Doji
plotshape(isRickshawManDoji, style=shape.triangleup, location=location.belowbar, color=color.purple, size=size.small)
Four Price Doji
//@version=5
indicator(title=”Four Price Doji Candlestick Pattern”, shorttitle=”Four Price Doji”, overlay=true)
// Condition for Four Price Doji
isFourPriceDoji = open == close and low == low[1] and high == high[1]
// Plotting Four Price Doji
plotshape(isFourPriceDoji, style=shape.triangleup, location=location.belowbar, color=color.black, size=size.small)
Tri Star Doji
//@version=5
indicator(title=”Tri Star Doji Candlestick Pattern”, shorttitle=”Tri Star Doji”, overlay=true)
// Condition for Tri Star Doji
isTriStarDoji = close == close[1] and close[1] == close[2] and open == open[1] and open[1] == open[2]
// Plotting Tri Star Doji
plotshape(isTriStarDoji, style=shape.triangleup, location=location.belowbar, color=color.white, size=size.small)
Using Chatink to find Doji Candle
Apart from Trading View we can also Scan and find the Doji Candle in Chartink.com, Chartink is relatively simple to use and provides a option to use ready made candlestick patters created by other fellow users of the platform
You can simple search in the search box the pattern name and you will be able to find a lot of Pattern Scanners for a particular patter
To make your work simpler I have created a who lot of different scanners , you can simple click here to see all those scanners.
Doji Candlestick Reversal Strategy
Trading Strategies Using Doji Candlestick
Signal: Look for a Doji after a prolonged uptrend or downtrend.
Action: If a Doji forms after an uptrend, consider a potential reversal to the downside. If it appears after a downtrend, expect a potential reversal to the upside.
Confirmation: Confirm the reversal signal with extra technical analysis tools or indicators.
Doji as a Trend Continuation Signal
Signal: Identify a Doji in the middle of a strong trend.
Action: Consider the Doji as a signal that the prevailing trend is likely to continue. The Doji represents indecision. It may state a brief pause before the trend resumes.
Confirmation: Confirm the continuation signal with trendlines, moving averages, or other trend-following indicators.
Combining Doji Candlestick with Support/Resistance:
Signal: Look for a Doji forming near key support or resistance levels.
Action: A Doji at support may suggest potential buying opportunities. A Doji at resistance may signal a potential reversal to the downside.
Confirmation: Use other technical analysis tools to confirm the support or resistance level. Also, consider more indicators.
Doji Candlestick and Volume Analysis
Signal: Observe volume levels accompanying the Doji.
Action: A higher volume with a Doji may state stronger conviction. It could signal a potential reversal or continuation.
Confirmation: Confirm Doji signals by analyzing volume patterns. Compare them with historical data.
Common Mistakes to Avoid When Analyzing Doji Candlestick
1) Ignoring Market Context
Using a Doji in isolation without considering the broader market context.
Always assess the Doji’s significance with the prevailing trend. Also, consider support/resistance levels and market conditions. Confirm with later price action.
Wait for confirmation through the next few candles. Use more technical indicators to support the Doji signal.
2) Disregarding Timeframes:
Focusing on a single timeframe. Considering Doji’s appearance on many timeframes is a mistake.
3) Neglecting Volume Analysis
Ignoring the volume associated with the Doji.
Pay attention to volume levels. The volume level may state whether a Doji signal is strong or weak.
4) Expecting Immediate Results:
Anticipating an immediate price reversal or continuation based on a Doji.
Be patient and wait for confirmation over the next candles. Consider the Doji as part of a gradual shift in market sentiment.
5) Ignoring Candlestick Body Size
Disregarding the size of the Doji’s body compared to previous candles.
A small Doji might have limited significance, while a larger one may carry more weight. Consider the size relative to recent price action.
6) Using Doji Patterns in Isolation
Relying on Doji patterns without incorporating other technical analysis tools.
Combine Doji signals with trendlines, moving averages, and other indicators. This enhances the reliability of trading decisions.
7) Overtrading Based on Doji Alone
Executing trades based on Doji patterns.
Use Doji signals as part of a well-rounded trading strategy. Avoid overtrading. Consider risk management principles.
8) Ignoring News and Events
Ignoring significant news or events that could impact the market context.
Stay informed about economic events and news releases. They influence the market.
Conclusion
Understanding Doji candlestick patterns in trading can give valuable insights into market dynamics. They can also state potential trend reversals.
FAQ
A doji can signal both bullish and bearish sentiment depending on its context within the price action.
A doji candlestick suggests indecision in the market, where the opening and closing prices are very close to each other, resulting in a small body with long upper and lower wicks.
Yes, a Doji can indicate a potential reversal in the prevailing trend, especially when it occurs after a prolonged uptrend or downtrend.
To confirm a doji candle, you should look for confirmation from other technical indicators or patterns, such as volume analysis, support and resistance levels, or additional candlestick formations.
Traders may use doji candles to make trading decisions by observing the subsequent price action. For example, a doji followed by a strong bullish or bearish candle may signal a continuation of the trend, while a doji at a key support or resistance level could indicate a potential reversal.
A perfect doji occurs when the opening and closing prices are exactly the same, resulting in a horizontal line for the body of the candlestick.
The accuracy of a doji pattern depends on various factors such as market conditions, timeframe, and other supporting technical indicators. While it can be a reliable signal in certain situations, it’s not foolproof and should be used in conjunction with other analysis techniques.
A neutral doji occurs when the opening and closing prices are nearly identical, indicating a balance between buyers and sellers and uncertainty in the market direction.
A hammer doji is a bullish reversal pattern characterized by a small body with a long lower wick, resembling a hammer. It suggests that sellers pushed the price lower during the session, but buyers ultimately pushed the price back up, indicating potential bullish strength.


I’m Prathamesh Tawde, a leading figure in the dynamic world of financial markets. Born on March 30, 1986, in the vibrant city of Thane, Maharashtra, I’ve nurtured a profound passion for technical analysis and a commitment to guiding individuals toward successful trading journeys. With a mission to empower and educate, I’ve carved a distinct niche as a content creator, educator, and mentor.
