

Mastering the Three Black Crows Pattern for Profitable Trades
- Prathamesh Tawde
- December 16, 2023
Introduction
In trading, understanding market patterns is crucial. They help you make informed decisions. One such pattern that holds significant importance is the Three Black Crows pattern. This bearish reversal pattern can give traders insights. It shows potential market downtrends. So, what exactly is the Three Black Crows pattern, and why is it so important in trading?
Definition of three black crows candlestick pattern
Characteristics of the Pattern
The Three Black Crows pattern is made up of three bearish candlesticks. Each has a long body and little to no shadow. These candlesticks usually open within the previous candle’s body. They close lower, showing strong selling.
Formation of the Pattern
This pattern forms after an uptrend, signaling a potential reversal. Each of the three candles opens inside the last one. They close at lower levels. This shows the shift from bullish to bearish sentiment.
Historical Context and Origin
Origin of Candlestick Patterns
Candlestick patterns have their roots in 18th-century Japan. Rice traders used them to track and predict market moves. These patterns have evolved over time and modern trading practices have integrated them.
Evolution in Modern Trading
Today, candlestick patterns are widely used in many financial markets. They’re used in stocks and forex. This is due to their reliability and the ease of interpretation.
Components
First Crow: The Initial Drop
The first candlestick marks the start of the bearish trend. It closed much lower than the last candle, showing that sellers are taking control.
Second Crow: Continuation of the Downtrend
The second candlestick continues the downtrend. It opened inside the first and closed even lower. This reinforces the bearish sentiment and adds to the pattern’s credibility.
Third Crow: Confirmation of Bearish Sentiment
The third candlestick confirms the pattern. It opened within the second candle’s body and closed at a new low. This solidified the bearish outlook.

Psychology Behind the Pattern
Trader Sentiment and Behavior
The pattern shows a shift in trader sentiment. It goes from bullish to bearish. It shows that sellers are swamping buyers. This has led to a steady price decline.
Market conditions favoring the pattern.
This pattern works best in markets with a strong uptrend. There, a sudden shift in sentiment can cause big price drops.
How to Identify the Three Black Crows entry Pattern
Key Indicators to Watch
To find the Three Black Crows entry, look for three bearish candlesticks. Each has a long body and minimal shadows. Ensure that each candle opens within the previous one’s body and closes lower.
Common Mistakes in Identification
Avoid mistaking in Three Black Crows pattern with other similar bearish patterns. Check that the candlesticks meet the criteria. Also, confirm the pattern with other indicators for accuracy.
Significance in market analysis.
Implications for Traders
The pattern is a strong sign of a market reversal. It tells traders to exit long positions or enter short ones.
Use in Predicting Market Trends
By spotting this pattern, traders can expect more downward movement. They can then adjust their strategies accordingly.
Three Black Crows vs. Other Bearish Patterns
Comparison with Other Patterns
There are several bearish patterns. But the Three Black Crows stands out. This is due to its clear sign of a reversal. The Three Black Crows has three candlesticks. This sets it apart from the Evening Star or the Bearish Engulfing. This gives a stronger signal.
Unique Features of Three Black Crows
The pattern is unique because it forms the same way over three trading sessions. This makes it a reliable sign of lasting bearish sentiment.
Three Black Crows Pattern vs Three White Soldiers Pattern
Three Black Crows Pattern
Appearance: Three consecutive long bearish candlesticks.
Formation: Each candlestick opens within the last one’s body. Then, it closes lower.
Market Context: It appears after an uptrend.
Implication: This implies a bearish reversal. It signals that the market will likely continue downward.
Three White Soldiers Pattern
Appearance: Three consecutive long bullish candlesticks.
Formation: Each candlestick opens inside the previous one’s body. It closes higher.
Market Context: It appears after a downtrend.
Implication: The implication indicates a bullish reversal. It signals that the market will likely rise.
Practical Applications
Trading Strategies Involving Three Black Crows
Traders can use the pattern to inform their trading strategies. For instance, upon spotting the pattern, a trader might choose to enter a short position. They expect further price drops.
Case Studies and Examples
Consider a stock that has been in a strong uptrend. After forming the pattern, the stock drops a lot. This confirms the pattern’s predictive power. Such case studies underscore the pattern’s utility in real-world trading.
How To Find Three Black Crows Pattern Using Chartink.Com
Chartink.com Overview
Chartink.com is an online stock screener and charting tool. It lets traders scan for technical patterns and analyze market trends. Chartink.com has customizable filters and an easy interface. It’s a great resource for traders.
Below is the screenshot of how the websibsite looks , You can simply
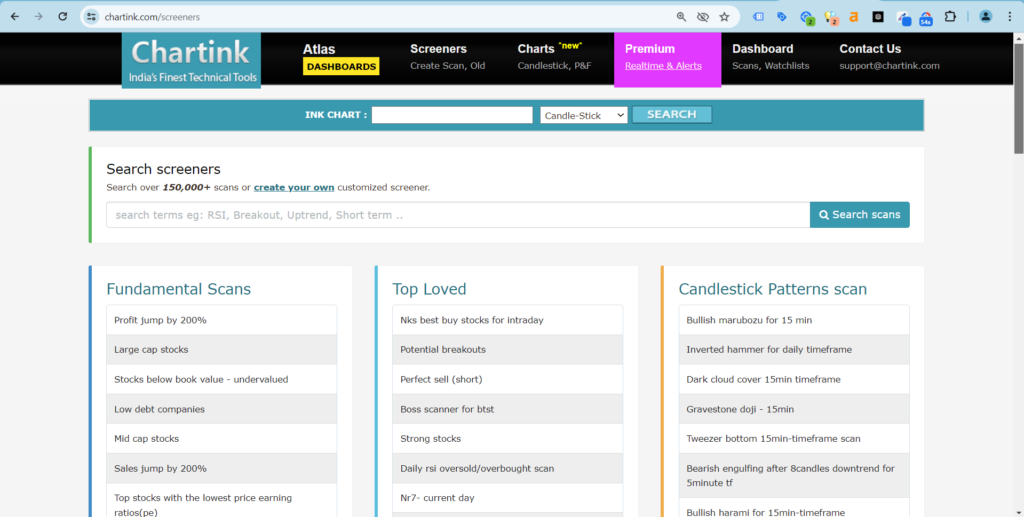
You can search for Three Black Crows Pattern. It will show you all stock charts regarding pattern.
Risk Management
Managing Risks Associated with the Pattern
Despite its reliability, trading based on the pattern involves risks. Traders should use risk management techniques. They can set stop-loss orders to protect against unexpected market moves.
Setting Stop-Losses and Limits
A prudent approach involves setting stop-loss orders. Put them above the first candle of the pattern. This limits losses if the market reverses.
Limitations and Misconceptions
Common Misunderstandings
Many people think that the pattern guarantees a market reversal. It’s a strong indicator. But, use it with other tools.
Limitations of Relying Solely on Three Black Crows
Relying only on this pattern is a mistake. You must also consider other factors, like market conditions and more indicators. Relying only on the pattern can lead to bad trades.
Technological Tools and Resources
Software for Identifying Patterns
Many tools can spot the pattern. They give alerts and automatic recognition to help traders.
Educational Resources for Traders
Many online resources can help traders learn about candlestick patterns. They include tutorials, courses, and articles. These resources teach traders to use the patterns well in their trading strategies.
Expert Opinions
Insights from Professional Traders
Many pro traders see the pattern as a reliable sign. It shows that the market will reverse. Their insights and experiences can provide valuable guidance for novice traders.
Academic Perspectives
Academic studies on candlestick patterns often back their effectiveness. This includes the Three Black Crows. This further shows that they are useful in technical analysis.
Conclusion
The Three Black Crows pattern is a powerful tool for traders. It offers insights into possible market reversals. Understanding its formation, significance, and use helps traders. It lets them improve their market analysis and trading strategies. But using this pattern with other indicators and risk techniques is essential. They help you make informed and effective trading decisions.
FAQs
The Three Black Crows pattern is a bearish candlestick pattern. It signals a potential switch from an uptrend to a downtrend. It has three long bearish candles in a row. They have short or no lower shadows. Each opens within the last candle’s body and closes lower.
The pattern is reliable. It shows a shift from bullish to bearish sentiment over three trading days. It gives a strong signal of a potential market reversal.
High trading volume can strengthen the pattern’s validity. It shows strong selling pressure and raises the chance of a continued downtrend.
Beginners can learn to spot the Three Black Crows pattern by studying guides. They can also practice on demo accounts and use trading platforms with pattern tools. This way, they gain hands-on experience.
Traders often make these mistakes. They enter trades without extra confirmation. They ignore the overall market context and skip using stop-loss orders. It’s key to wait for confirmation from more indicators or patterns. Use proper risk management too.


I’m Prathamesh Tawde, a leading figure in the dynamic world of financial markets. Born on March 30, 1986, in the vibrant city of Thane, Maharashtra, I’ve nurtured a profound passion for technical analysis and a commitment to guiding individuals toward successful trading journeys. With a mission to empower and educate, I’ve carved a distinct niche as a content creator, educator, and mentor.
